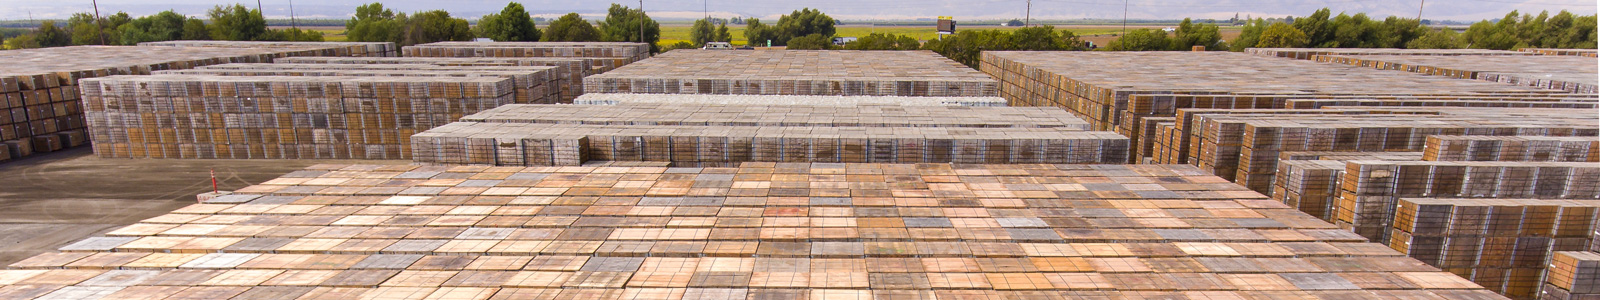
Balancing act ahead for the 2021 US tomato processing season.
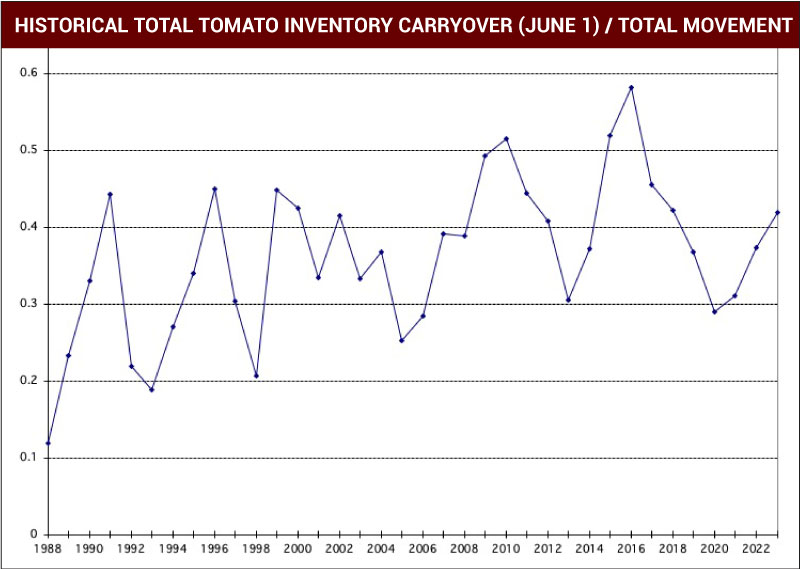
One may ask: why is the California tomato industry already signaling a 2021 pack year tightness, with the new season still over four months away? We are at a point in our planning where we have a good view of what tonnage is possible to achieve for the upcoming season; acres are booked, and seedlings will start going into the ground shortly. Our industry is also tracked quite carefully and has good transparency of industry data, such as historical consumption averages (usually referred to as movement), and the collective US tomato industry inventory position published by the California League of Food Producers (CLFP). Numbers are always translated back to equivalent tons of fresh tomatoes in industry talk, making our position easier to review.
No one can predict the future, but we are able to tell you what we see right now. Taking into account the industry inventory position communicated by the CLFP on December 1, 2020, the five-year average historical movement patterns (which typically see a slowdown in the second half of the year), and knowledge of Morning Star’s own position and how it relates to the industry, we forecast a June 1, 2021, US total industry inventory of 3,485,000 equivalent fresh tons.
We expect the 2021 California crop to be about 11,750,000 tons and the rest of the US adding 500,000 tons for 12,250,000 tons of total production. Add the June inventory, and we see the industry heading into next year with 15,735,000 tons in the barn. History points to an annual movement close to 12,740,000 tons; however, Morning Star expects to experience a 600,000-ton loss of industry exports, landing us at a consumption of 12,140,000 tons for 2021/2022. This would leave the US industry with 3,595,000 tons in inventory on June 1, 2022.
| INVENTORY AND MOVEMENT | EQUIVALENT FRESH TONS |
|---|---|
| Total US Industry Inventory - June 1, 2021 | 3,485,000 |
| 2021 California Season Production | + 11,750,000 |
| 2021 Rest of the US Production | + 500,000 |
| Total 2021 US Availability | 15,735,000 |
| Less | |
| Historical 12 Month US Movement | - 12,740,000 |
| Adjustment for Loss of Exports | + 600,000 |
| Total US Industry Inventory - June 1, 2022 | 3,595,000 |
What does this all mean? If everything is perfectly balanced, the industry would have inventory on June 1 to cover customer demands for over three months, leading into the month of September. The current inventories for June 1, 2021 and 2022, are expected to be about 30% of four-year average historical movement, and 30% of a year is 3.6 months. To put this in perspective for those who remember, we can compare to the US industry inventory on June 1, 2014, coming out of the short curly top disease-affected 2013 crop, which was about 4 million tons.
As we all deal with an imperfect 18-month planning cycle, with inventories that are never perfectly in step with movement, things get demanding from a planning standpoint, or what you might call tight. The takeaway is that we need to be very rigorous in making sure our 2021 pack is well-proportioned according to customer needs. We hope to be able to engage in detailed movement forecasting reviews with each of our customers in order to help us strike just the right balance.
###

Morning Star Newsletter now distributed electronically
As a reminder, Morning Star is now distributing our newsletters electronically using an email distribution vendor called Mailchimp. Your e-version will now include informative Morning Star videos and highlights. Depending on your company's firewall, these emails may initially be directed to you spam folder.